Singapore Theatre in 2023

By adelyn-1800, 22 December, 2023
Published on
Masthead
Masthead (Image)
The words 'Singapore Theatre in 2023' in orange and brown font against a light yellow background.
Reading Duration
15 minutes
Body Content
Body Text

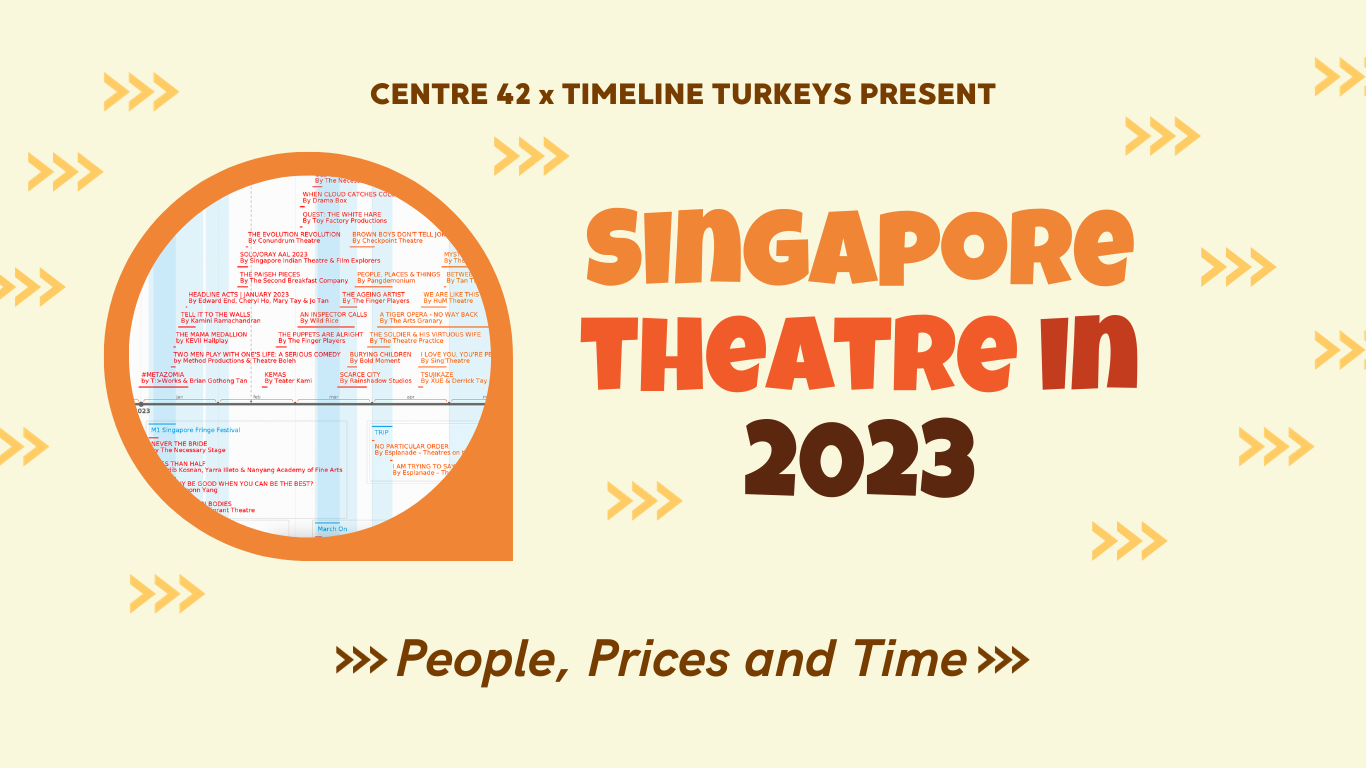
People, Prices and Time

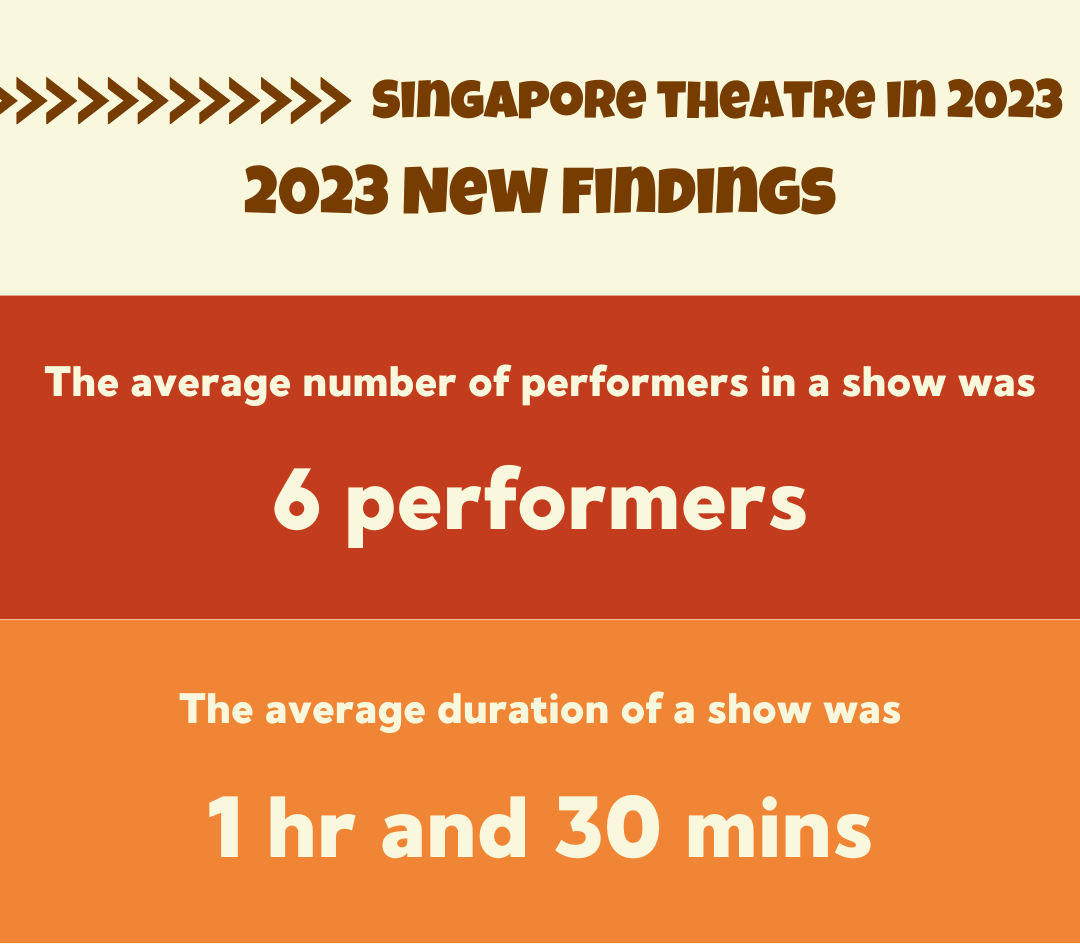
2023 marks the seventh year that Centre 42 maps the wide range of local theatre productions staged in one calendar year. On 13 February 2023, Singapore stepped down all COVID-related requirements - with the pandemic well and truly behind us, we look at how things have changed for the scene (or not). This year's focus comes down to three important aspects of local theatre - the people; the ticket prices; the amount of time we spend in the theatre. More on the trends we discovered below; for now, here's an overview of what Singapore Theatre looked like in 2023. 

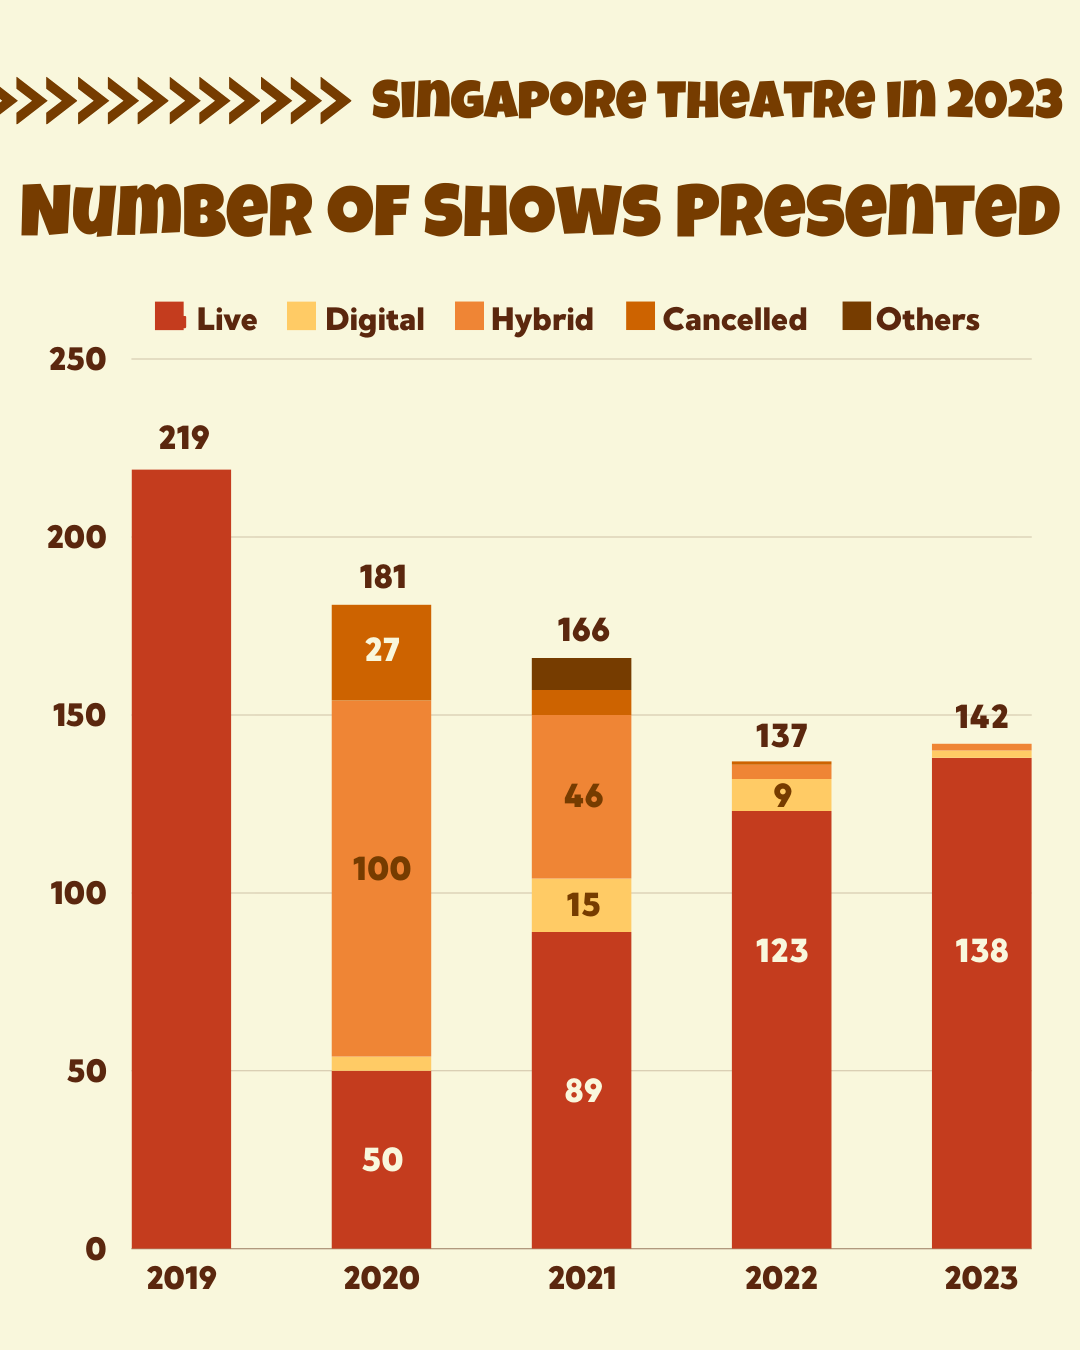
We have seen a total of 142 shows, including: 

  • 138 in-person performances
  • 2 digital theatrical performances (these include performances that were performed live online or pre-recorded for streaming/video-on-demand)
  • 2 hybrid theatrical performances (simultaneously performed live and online) 

View this year's interactive timeline below! Click on the 'Full Screen' button in the embedded timeline for the best viewing experience; click and drag to explore different months of the year, and click on each individual production to find out more about it! Shows that were presented as part of a festival are grouped together under a blue festival heading and located in the bottom half of the timeline. 

Body Text

Body Text

Unable to view the interactive timeline? Check out the static versions below, available as an image and a PDF! 

Body Text

[scrollable-image imageUrl="https://c42-archive-prod-files-acl.s3.ap-southeast-1.amazonaws.com/public/2023-12/Singapore%20Theatre%20in%202023%20Timeline.jpg" caption="" alt=""][/scrollable-image]

Caption

Singapore Theatre in 2023

Body Heading
Statistics and Trends
Body Text

Productions

What else can we glean from our timeline? The total number of productions staged this year has seen a slight increase, from 137 in 2022 to 142 in 2023, but still nowhere near 219, the number of productions that were staged in 2019, the last year before the pandemic. It remains to be seen if an upward trend will continue - check in again next year! 

Body Photograph
A bar graph showing the number of theatre productions presented in 2023.
Body Text

While the total number of productions has stayed relatively stable, we've seen a jump in productions staged as part of a festival or series, from 39 in 2022 to 50 in 2023. While the number of festivals has stayed stable - we identified 12 in 2022 and 13 in 2023 - they have certainly featured more productions this year! A few examples include Esplanade's March On, which featured only 1 theatre production in 2022 but 5 in 2023, as well as the Singapore International Festival of Arts, which featured 4 theatre productions in 2022 versus 7 in 2023. 

Body Photograph
A horizontal bar graph showing the number of shows presented as part of festival and series in 2023.
Body Text

A quick comparison of last year's timeline to this year's also shows the difference in peak periods! Last year, the busiest months were November, featuring 19 productions; July, featuring 17 productions; and August, featuring 16 productions - far more concentrated in the second half of the year. In 2023, the busiest months were May, featuring 21 productions; March and September, both featuring 20 productions; and August, featuring 19 productions. This could be attributed to the timing of this year's festivals and series - March On and the NUS Arts Festival run in March; the Singapore International Festival of Arts occurs across May to June; and Esplanade's The Studios, the Singapore Night Festival, the ExxonMobil Campus Concerts, and Toy Factory Productions' The Wright Stuff are spread out over August and September. 

Body Text

Ticket Prices

We've also seen quite a sharp increase in ticket prices! The average lowest and highest ticket prices have both risen more than $9 in the span of just two years. The average lowest ticket price was $25.43 in 2021, $29.32 in 2022, and shot past the $30 mark to $34.74 in 2023. In comparison, the average highest ticket price was $38.69 in 2021, went up to $45.39 in 2022, and saw another slight increase to $47.08 in 2023. This accompanies a national increase in GST rate (from 7% to 8% from 1 January 2023) and 5% rate of inflation - it seems that everything is becoming more expensive, and theatre tickets are no different! 

Body Photograph
A line graph showing the rise in ticket prices for productions from 2021 to 2023.
Body Text

Restagings

With all other statistics on the rise, it appears that this also applies to the number of restagings and adaptations this year - from 14 in 2022, to 18 in 2023.

Body Photograph
A horizontal bar chart showing the makeup of productions in 2023.
Body Text

Check out the past stagings of these productions on the C42 Archive of Singapore Theatre!

Body Text

New Statistics

This year, we've also started tracking some exciting new statistics to gather even more data about the shape of our theatre scene. These include the following:

  • Number of TYA (Theatre for Young Audiences) productions. There were 30 such productions in 2023. At 21% of total productions, this meant a lot of shows out there for children, youths, and families! 
  • Number of productions with access options. We were keen to find out more about how theatre productions are being made more accessible to audiences with different needs. 29% of productions this year offered some kind of access option, including (but not limited to) audio description, close captioning, relaxed performances, sign language interpretation, and wheelchair access at show venues. This is one statistic we definitely hope to see increasing, making the theatre scene more welcoming to audiences of all backgrounds and needs. 
Body Photograph
Two pie charts showing the percentage of TYA productions and productions with access options in 2023.
Body Text

We also tracked: 

  • Number of performers in each production. This year, the average number of performers per production was six. 48 productions had more than six performers in the cast, with The Theatre Practice's Four Horse Road topping the chart at 26 performers. Sounds like quite a lot to us - we'll be keeping an eye out next year to see if casts and ensembles get larger! 
  • Length of productions. Does it feel like you've spent a really long time in theatres this year? Our best estimate for the average length of a 2023 production was 1h 30m, and it seems like 20 - 30% of productions ran even longer than that. The most notable of these would be HOTEL by Wild Rice - this two-part production lasted a whopping 4h 45m in total! 
Body Photograph
A short infographic showing the average number of performers and average length of productions in 2023.
Body Text

You can view more infographics about Singapore Theatre in 2023 via this link!

Body Heading
FAQ
Body Content
Body Text

In tracking the data for Singapore Theatre in 2023, we relied primarily on listings of productions from two sources: the Channel NewsTheatre Telegram Channel as well as the ArtsRepublic website. We also drew information from various theatre companies’ websites, other listing platforms such as Catch, and ticketing platforms such as SISTIC, Peatix, and Eventbrite. 

As with the previous iterations, we rely on the public to help us build a comprehensive picture of the year. An open call was made on 17 November 2023 for additions and edits to be made to the data tracker sheet. The open call was closed on 1 December 2023, and the Singapore Theatre in 2023 timeline was first published on 29 December 2023.

This year, Centre 42 worked with grassroots collective The Timeline Turkeys to collect data for the timeline. To complement our work, they have created several online activities that the theatre-going public can enjoy! Help build the photo wall of 2023 theatre, share your thoughts on what you watched this year, and find out what kind of theatre-goer you were here

Title
What are the sources for your data?
Body Content
Body Text

We included productions that publicised themselves as local theatre productions and were marketed to a public audience. We do not include productions presented by foreign theatre companies; closed-door presentations; comedy/standup, dance productions, and all other productions that do not explicitly label themselves as 'theatre'. 

Title
What was your inclusion criteria?
Body Content
Body Text

For every production, we find out the price of the cheapest ticket sold (including concessions), as well as the most expensive (highest-tier) ticket sold. 'Average lowest ticket price' is calculated by averaging the total of all cheapest tickets and 'average highest ticket price' is calculated by averaging the total of all highest-tier tickets. Productions offering only one ticket price are included in calculations for both lowest and highest ticket price.

Title
How did you calculate the average ticket prices?
Body Content
Body Text

We looked at productions that explicitly labelled themselves as TYA, as well as productions that publicised themselves for young audiences (children and youths). 

Title
How did you define TYA productions?
Body Content
Body Text

Yes! If you would like to suggest a production to add to the timeline, or if you have any other questions about the timeline and the data we have collected, please email us at info@centre42.sg.

Title
Can I submit a production you missed?
Body Content
Body Text

Click below to view the Singapore Theatre timelines for previous years.

Title
Where can I view your previous timelines?
Body Heading
Acknowledgments
Body Text

RESEARCH & ANALYSIS
Adelyn Tan
The Timeline Turkeys (Ke Weiliang, Lee Shu Yu, Mark Cheong, Philippe Pang)

DESIGN & LAYOUT
Adelyn Tan
Jaclyn Chong

DATA VISUALISATION TOOLS
Timegraphics
Canva

SPECIAL THANKS
Channel NewsTheatre

Published: 29 December 2023 

Thumbnail
Teaser Name
Centre 42
Teaser Date
Date
Date format
Whole date is confirmed
Media Type
PDF
Photograph